Dental practices can commission an Edmonton SEO audit to measure their own service queries, competitors and geographic coverage. This research explains the method; an Edmonton SEO audit uses the business’s agreed scope and a separate baseline.
The Measurement
Two instruments, one date. On July 20, 2026 we pulled organic and map-pack results for 483 distinct dentist-related keywords across Edmonton, top-20 deep, desktop and mobile separately. In parallel we ran a 90-point Share of Local Voice geo-grid: a 10-by-9 lattice of fixed points spaced roughly 1.8 kilometres apart, each one a real mobile local-finder search for “dentist” run from that exact location. Across the two methods, 296 distinct businesses showed up somewhere in the results. This is the same measurement we open every client engagement with, applied across an entire category instead of one business.

How to Read This Study
Every number below traces to a specific sheet, grid cell, or raw file from that July 20 pull. The source run retrieved 1,002 raw tasks, deduplicated to 957, and a re-pull consistency check on 35 duplicated keywords found 28 identical number-one results, with the rest showing normal search-result flux. The dentist market study’s 56,570 monthly searches figure is the single most specific, most checkable proof point on the subdomain today. If a number in this study cannot be traced to the raw pull, it does not belong in the study.
The Market Is a Head-Term Story
The 483 tracked keywords carry a combined 56,570 searches a month, and the top 10 keywords by volume alone hold 77.8% of it. The top 20 hold 90.3%. The remaining 463 keywords, the entire long tail, split the last tenth. Demand in a local category is rarely spread evenly across hundreds of phrases: it concentrates hard on a small set of head terms, and a business that has not confirmed where its own category’s volume sits is very likely optimizing for the wrong list.
The Query Universe, Snapshot
| # | Keyword | Searches / month |
|---|---|---|
| 1 | dentist near me | 8,100 |
| 2 | dentists Edmonton | 5,400 |
| 3 | dentist Edmonton | 5,400 |
| 4 | Edmonton dentist | 5,400 |
| 5 | dentistry Edmonton | 5,400 |
| 6 | Edmonton dentistry | 5,400 |
| 7 | dental clinic near me | 4,400 |
| 8 | dental clinic Edmonton | 1,900 |
| 9 | orthodontist Edmonton | 1,600 |
| 10 | teeth whitening Edmonton | 1,000 |
| 11 | teeth bleaching Edmonton | 1,000 |
| 12 | denturist Edmonton | 880 |
| 13 | pediatric dentist Edmonton | 880 |
| 14 | denturist near me | 880 |
| 15 | veneers Edmonton | 720 |
Source: Keyword Metrics sheet of the July 20, 2026 SERP pull. The five 5,400-volume head terms are word-order variants Google reports as separate tracked keywords.
Where the Demand Actually Sits
Monthly search volume by category, all 483 keywords
Twelve categories, summing to exactly 56,570/mo across 483 keywords. Emergency and urgent queries, 35 keywords, carry just 100/mo of tracked volume, and that gap between perceived and measured demand decides who wins them.
The Map Pack Is Almost Everywhere, and Almost Nobody Wins Both Layers
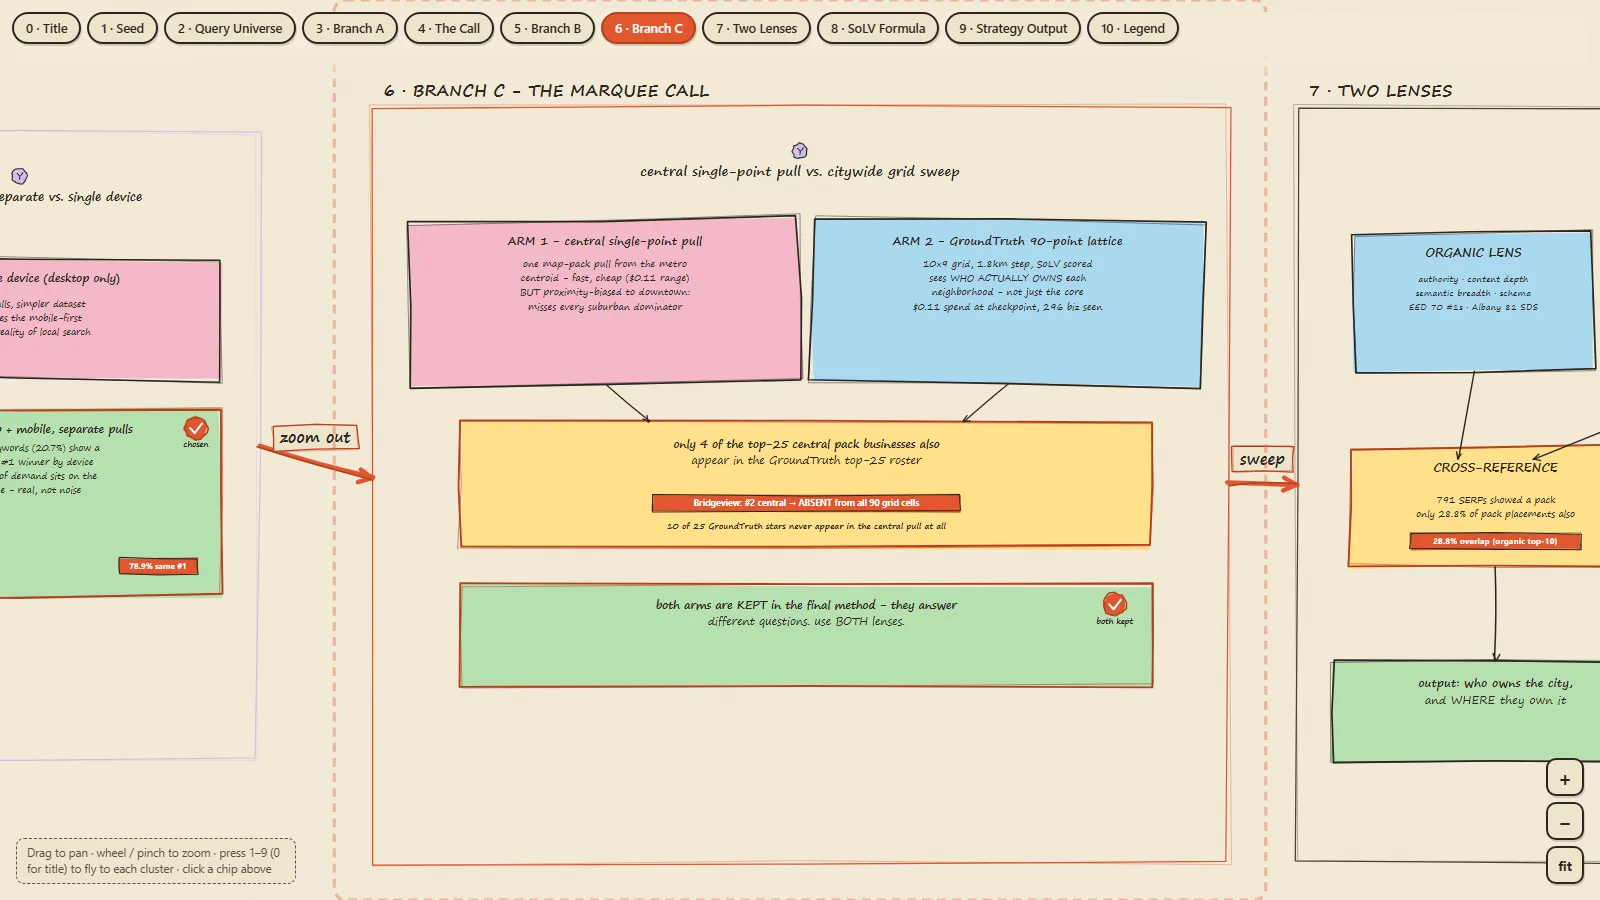
The local pack rendered on 93% of the 483 tracked queries, so nearly every dentist search in Edmonton surfaces a map pack above the organic results. But of the 1,407 website-matchable pack placements across the whole pull, only 405, 28.8%, also reached the organic top 10 for that same query. At the page level it is starker: of 791 query-device result pages showing a pack, only 263, one in three, had any pack business also present in the organic top 10. Winning the map pack and winning organic are, for most businesses in this market, separate contests decided by separate signals.
What Actually Renders on a Dentist Search
SERP feature prevalence across all 483 queries
Counted from the SERP-features column of the raw Keywords sheet, one row per tracked query.
AI Overviews Now Shadow Half the Market
AI Overviews appeared on 50.1% of tracked queries, against 0.6% for featured snippets and 5.4% for knowledge panels. Above-the-fold attention in this market is now contested by three layers at once: the AI summary, the map pack, and only then organic results. A strategy built for the ten blue links of five years ago is competing for the smallest slice of the screen.
The Grid Finds Winners a Citywide Pull Never Would
A conventional, single-location competitor pull for this market surfaced 195 businesses. Our 90-point grid observed 296. The two lists disagree about who is winning, and the disagreement is not noise: it is the difference between what Google serves from one query context and what a real customer standing somewhere in Edmonton actually sees.
Bridgeview: the Second Place That Does Not Exist
The citywide pull ranked Bridgeview Dental Clinic second in the entire market, with 125 pack appearances. The 90-point grid told a different story: Bridgeview was confirmed absent from all 90 grid cells. It never once appeared in the map pack from any fixed point we searched from across the actual city. A ranking that looks like a strong second place from one search location can be, from everywhere a customer might actually be standing, functionally invisible.
The Suburban Dominators the Citywide Pull Cannot See
| Business | Grid rank (of 296) | Citywide-pull rank (of 195) |
|---|---|---|
| The Dentists at Northgate | #1 | #75 |
| Forest Heights Family Dental | #2 | #18 |
| Westmount Dental Centre | #3 | #86 |
| Smiles Dental Group | #4 | #74 |
| Summit Dental | #5 | #71 |
| Southgate Dental Centre | #7 | never appears |
| Avalon Dental | #8 | never appears |
| Kensington Dental Clinic | #9 | never appears |
| Millwoods Dental Choice | #10 | never appears |
| Skyview Dental | #14 | never appears |
Ten of the grid’s top-25 businesses, including Southgate, Millwoods, Skyview, and Kensington neighborhood anchors, never appear anywhere in the citywide pull. Exactly 4 of the citywide top-25 also make the grid’s top-25.
The Albany Paradox: Winning Organic, Invisible on the Map
The clearest illustration in the entire dataset is a single business. Albany Dental holds the highest on-page score we measured in the market and the strongest organic footprint of any dentist in Edmonton, and it recorded zero appearances in the citywide, keyword-based map-pack pull across all 483 queries. The reason is geographic: Albany’s clinic sits roughly 10 kilometres from the market’s commercial centroid, four to eight times farther out than the businesses leading the pack. Proximity is a ranking input that no amount of on-page work overrides.
Albany Dental: value per crown
- 14 organic number-one rankings
- $40,750/mo in tracked volume behind them
- 81/100 semantic dominance score, highest measured
- 0 of 483 citywide map-pack appearances
- ~$2,911/mo of tracked volume per number-one held
edmontonemergencydentists.com: count without value
- 70 organic number-one rankings, most in the market
- ~$90/mo in tracked volume behind all of them
- 61/100 semantic dominance score
- #11 in the citywide pack pull; grid rank 104 of 296
- ~$1.30/mo of tracked volume per number-one held
Pound for pound, Albany’s fourteen number-ones carry roughly 450 times the tracked volume of the market leader’s seventy. Ranking counts, taken without the volume behind them, actively mislead.
Why Albany Wins the Organic Layer
Five measured structural advantages, none of them a secret: the only machine-readable review markup in the vertical, a 4.9 rating across 675 reviews emitted as schema; entity anchoring to Wikidata and Wikipedia nodes rather than plain text; a macro-to-micro homepage carrying ten of its fourteen number-ones from one URL with eleven H2 micro-sections; byte-identical desktop and mobile HTML at 157 kilobytes, which is why its number-one count nearly doubles on mobile, from five to nine; and a real publishing cadence, ten dated posts between March and July of 2026.
Why Albany Is Invisible in the Pack
Google’s location-prominence patent, US 8,046,371, folds website authority into the local score, and Albany maxes that input. But the same system carries a separate distance input that content cannot move, and Albany’s address is 10 kilometres north of the core against 1.2 to 2.8 for the pack leaders. The grid confirms the mechanism from the other side: from cells near Albany’s own address its listing hits best-rank number one, but it takes a top-three slot in only 1 of 90 cells. Its map-pack visibility is a narrow sliver around its own front door, not a citywide asset.
Desktop and Mobile Disagree More Than You Would Expect
Of the 483 tracked keywords, 100, roughly 21%, showed a different organic number-one result on desktop than on mobile, and that divergent set carries a combined 16,960 monthly searches. The divergence has named winners: Albany Dental took five mobile-only number-ones, the most of any domain, on the strength of its render-parity build, while Strathcona Dental took six desktop-only number-ones, the mirror image. How a site renders on mobile relative to desktop measurably shifted who won a fifth of this market’s divergent keyword set.
Every Exhibit, Straight From the Instruments
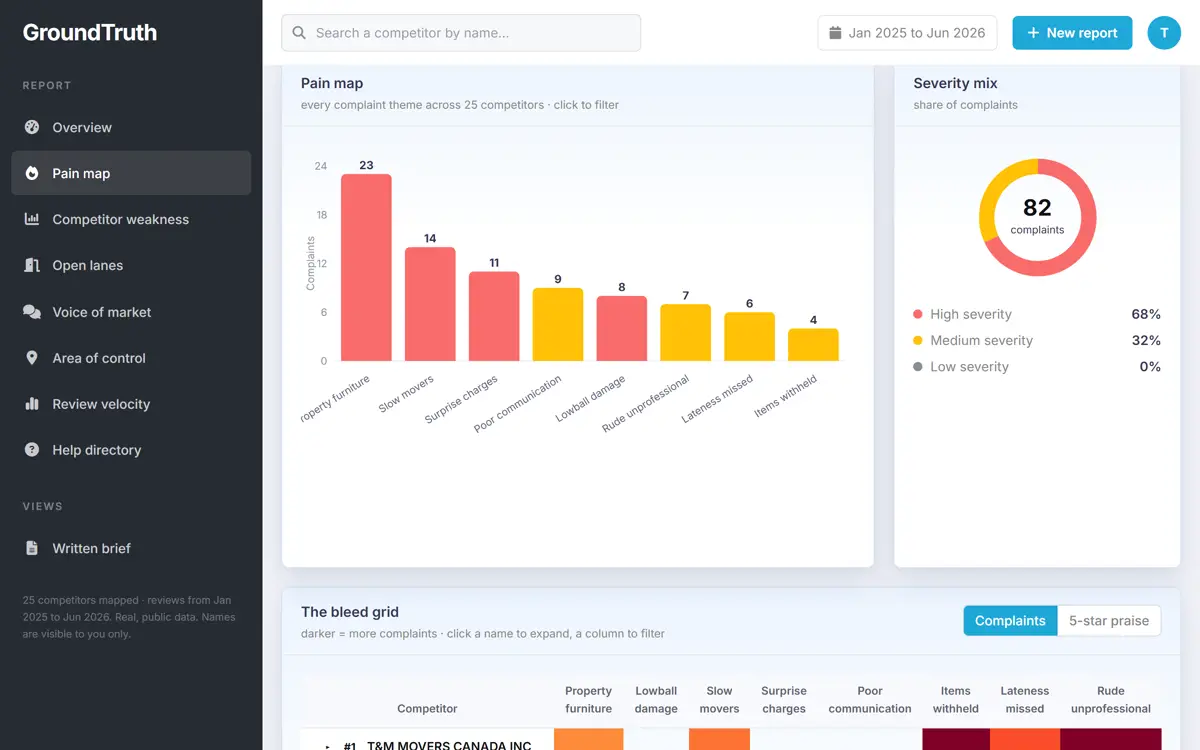
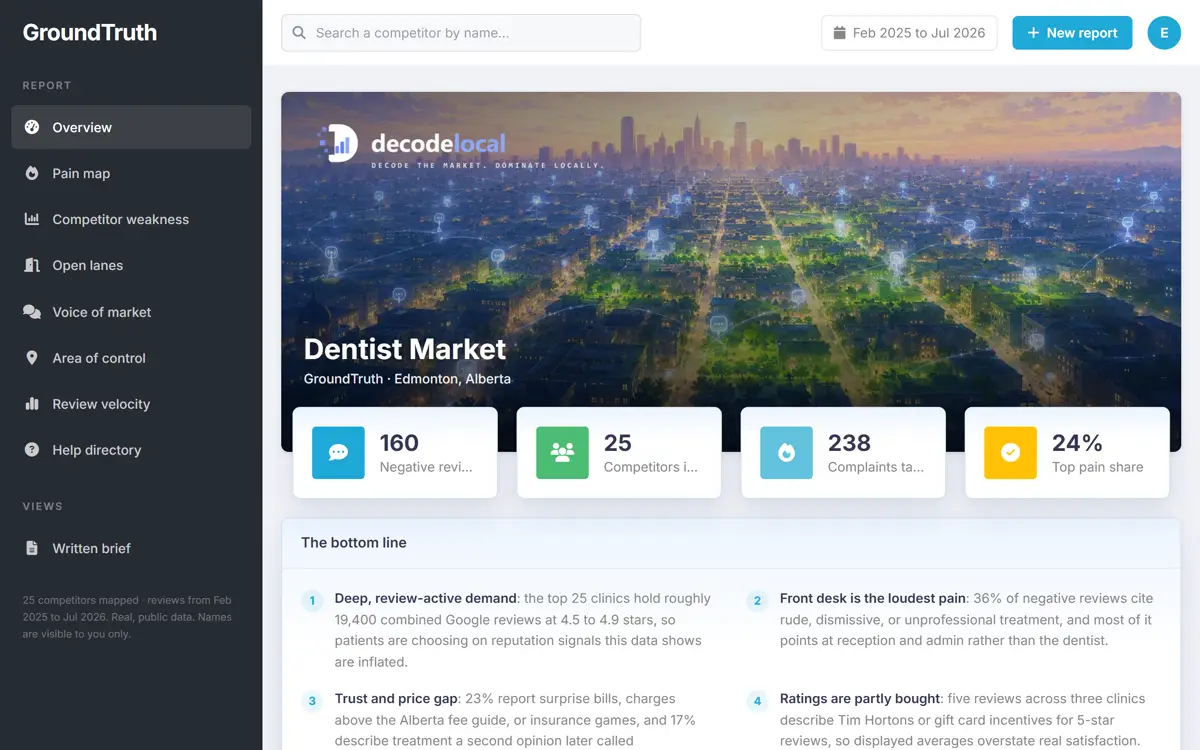
The screenshots below are real report output from the run behind this study, not mockups: the same GroundTruth and grid views a client sees in an engagement.
What This Means for Your Edmonton Business
None of this is really about dentistry. The same structure, a head-term-heavy demand curve, a map pack that renders constantly and rewards proximity over content, and a citywide pull that misses genuine local winners, shows up in essentially every competitive Edmonton category we have measured this way. Three questions from this study are worth asking about your own visibility before you spend anything on SEO:
Are you measuring from where your customers actually are, or from one office address that happens to be convenient to search from? A single search tells you almost nothing about a citywide market.
Do you know whether your gap is in the map pack, in organic, or in both, given that they are scored by different systems and, in this market, only 28.8% of pack placements also win the other layer?
Are you chasing ranking-count vanity metrics instead of the tracked search volume actually sitting behind those rankings, the way a 70-number-one, $90-a-month domain would tempt you to?
This is the measurement we run before we touch your site, your Google Business Profile, or a single piece of content: a full-market keyword pull and a 90+-point geo-grid, specific to your category and your part of the city. Read how we run this measurement in full, or see the whole practice on our main Edmonton SEO page.
More Categories, Same Method
This study is the first of several we are building for the Edmonton market, applying the same 90-point grid and full-market SERP pull to categories beyond dentistry, including towing and carpet installation. Each will be published on our research and evidence page as the measurement is completed, with the same standard applied every time: every figure has to trace back to a specific grid cell, a specific tracked keyword, or a specific SERP-feature count from the raw pull. If a number cannot be traced that way, it does not belong in the study.
Understand the measurement with our geo-grid rank tracking guide and Google review analysis guide.